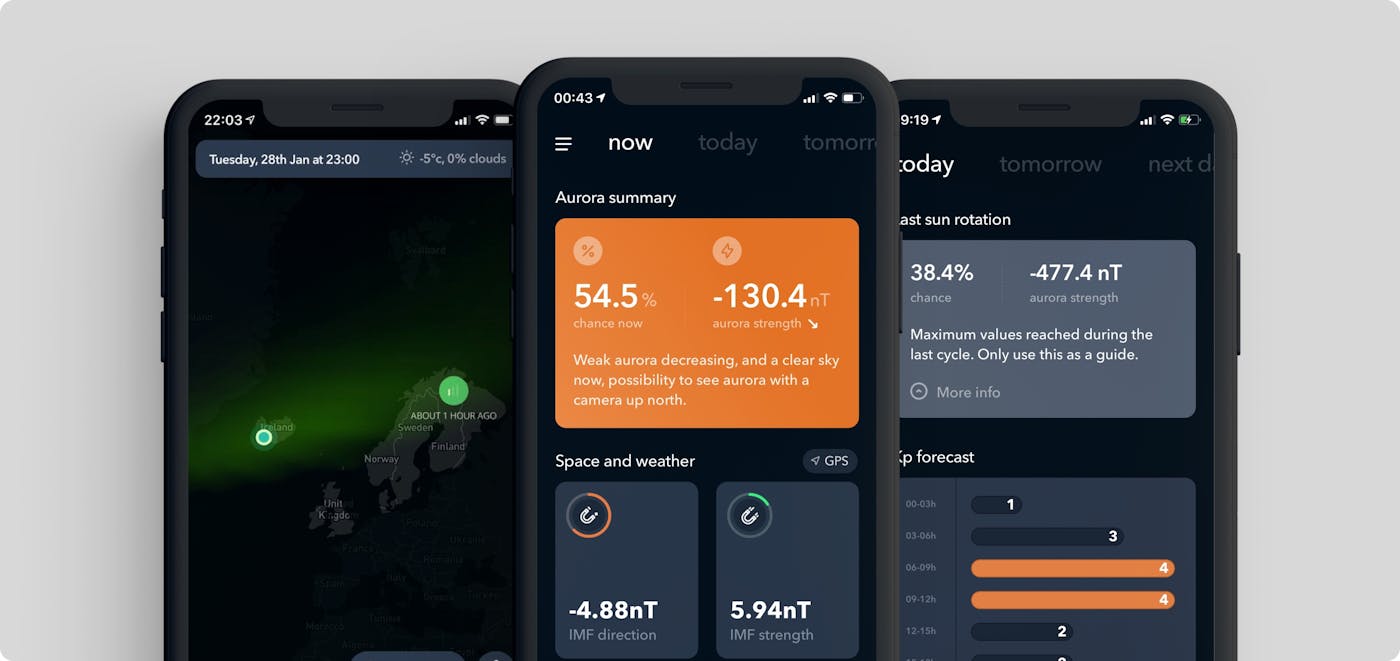
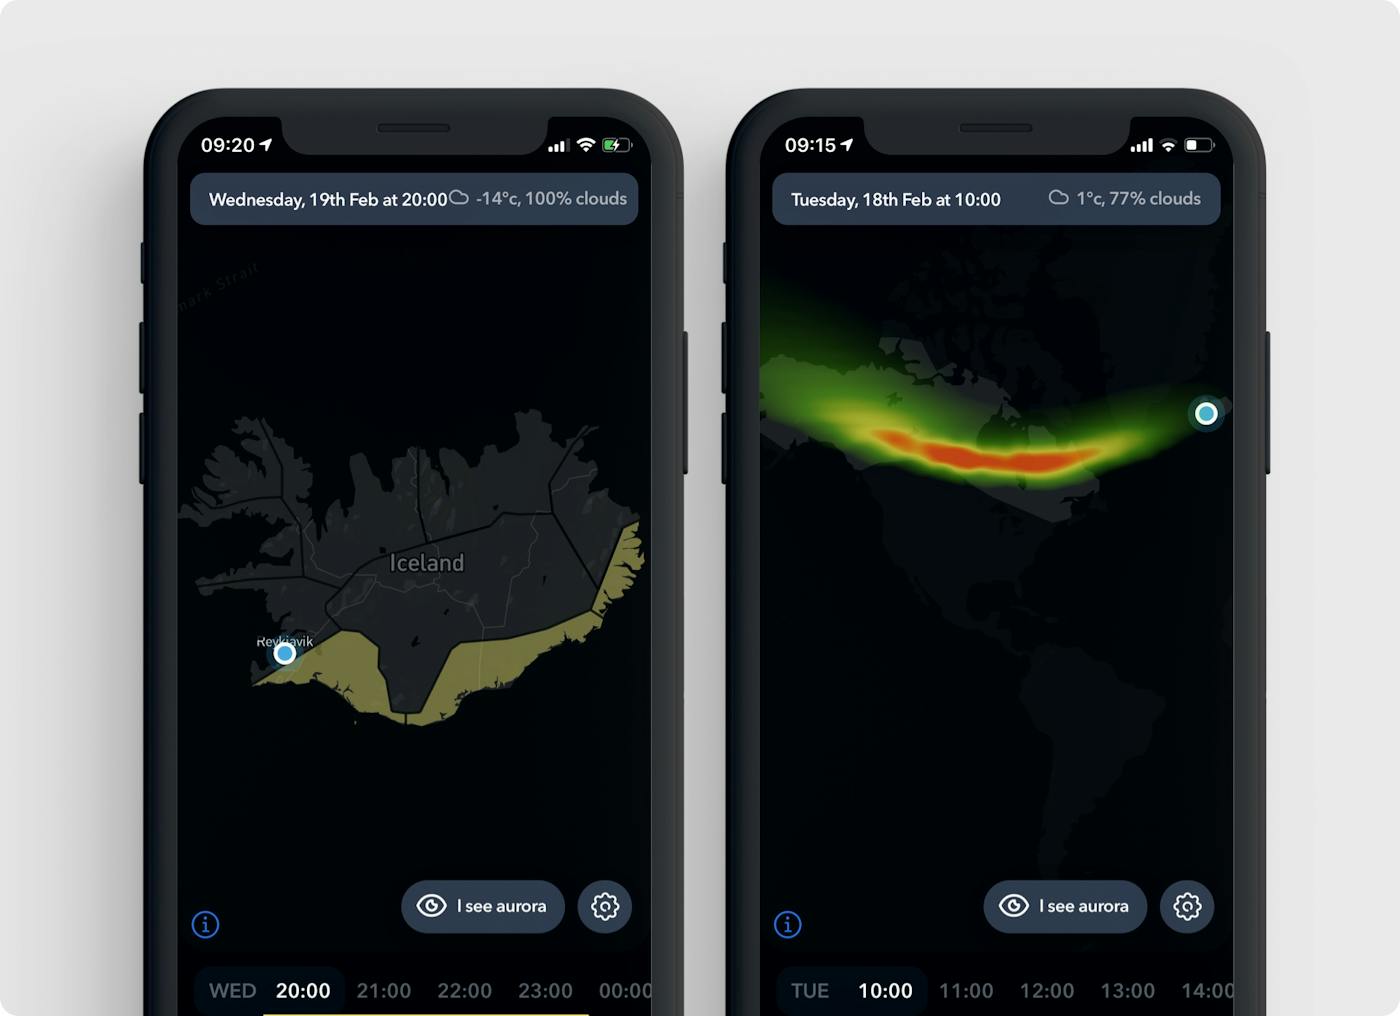
Winter is still ongoing, but we are getting closer to the end of Northern Lights for this season. Around two months remaining before days get longer and auroras won’t be visible anymore until next winter. Despite the shorter darkness we will have, this update is the biggest one we have since the launch and it is introducing loads of new features that will be very useful and for aurora enthusiasts. Let’s see what we have!
We started the application with basic features. We only use the GPS location and only one source for the aurora forecast which was from the NOAA (National Oceanic and Atmospheric Administration). On the last update, we added the feature where you can add multiple locations which were one of the most requested ones. This month we will introduce to you about 8 new features that rethink the app from the ground!
New sources
We are using NOAA to get real-time data for solar wind, Bt and Bz information, but we were also putting a huge focus on the Kp forecast/prediction.
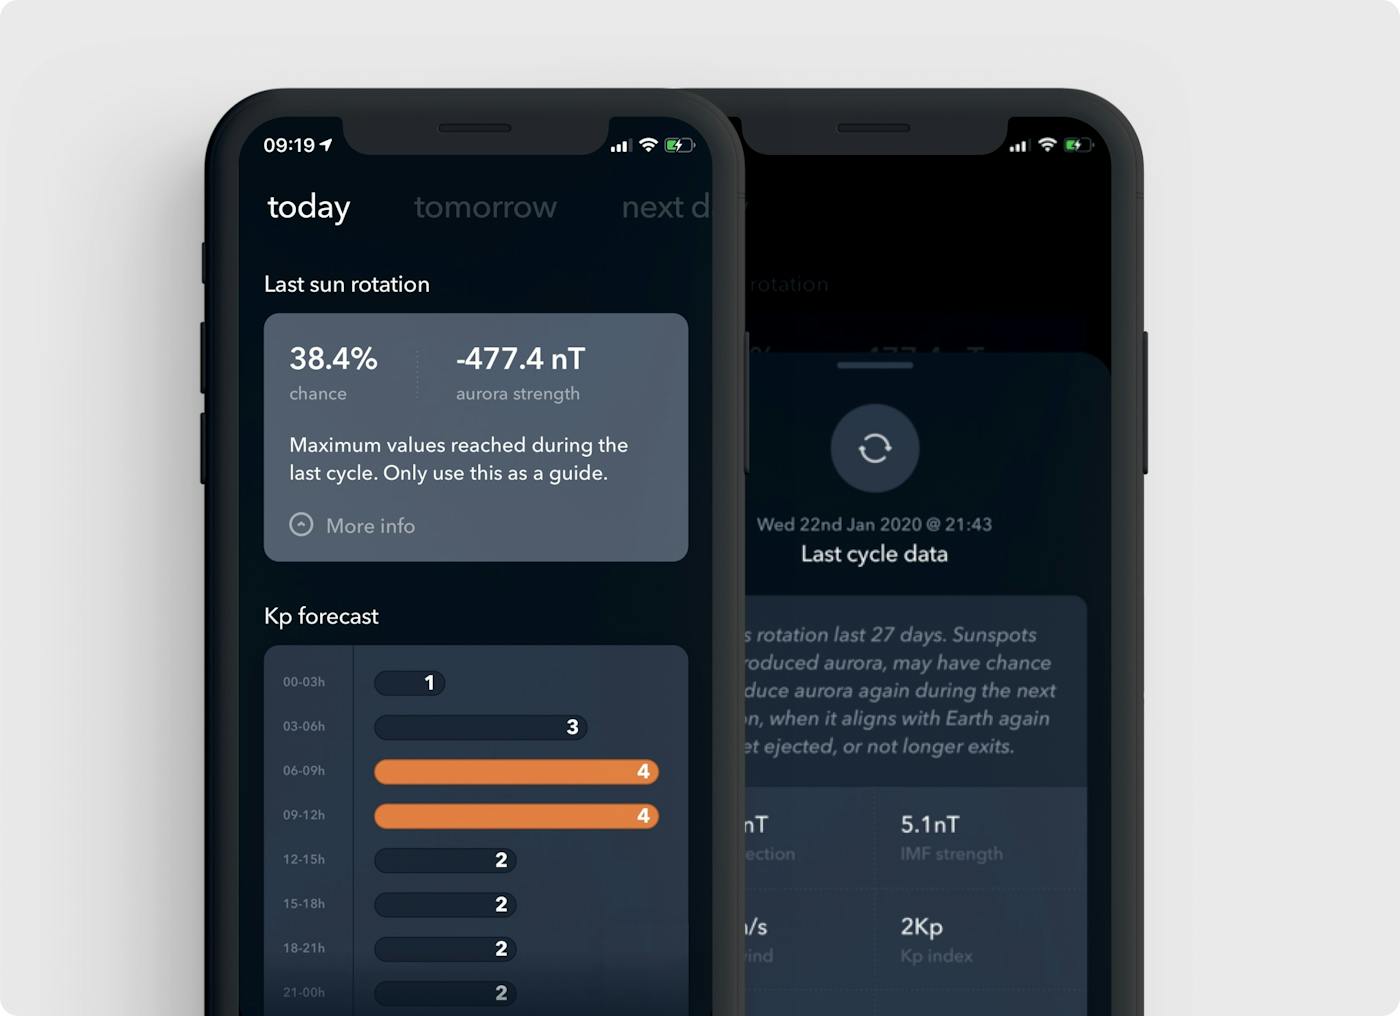
One of the most popular data that people can hear about is KP (Interplanetary index). It's an average value calculated using different stations across North Pole/North American countries. It gives an indicator of how strong the aurora display will be in the next 3-6 hours. Unfortunately, these data have been proven to be false many times. It's great to use it as an indicator but not as real-time data.
We contacted the formidable people at Tromsø Geophysical Observation (Norway) and Leirvogur Magnetic Observation (Iceland) to get access to their real-time data. They use magnetometers placed in different locations around Norway and are gathering data from other magnetometers from other countries.
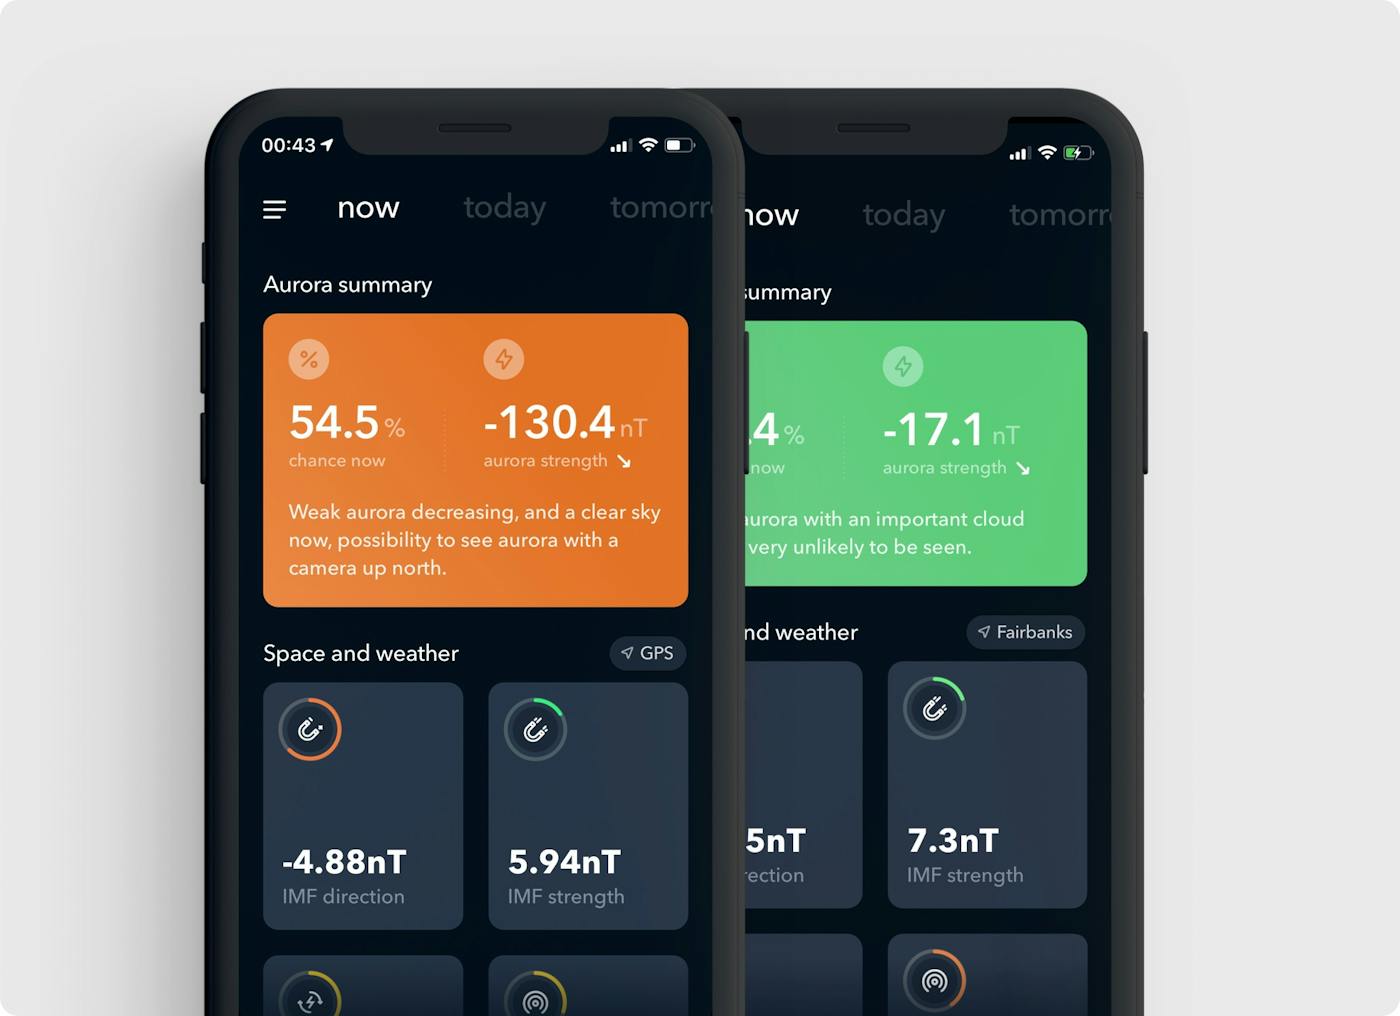
A magnetometer is a device that can get the fluctuation of the aurora in the Earth's magnetic field. When the value measured is dropping quickly in the negative (~-150nT), it means an aurora has a high chance to be dancing in the sky. The lowest is gets, the stronger the aurora will be. When in the opposite the value is growing a lot, it means the aurora is charging (~150nT) and will release with a display in the next minutes or will come back to an average value (~5nT).
We also use real-time data from the Swedish Institute of Space Physics and Finish Meteorological Institute that is available publicly.
In short, we now have real-time data coming from Norway (Tromsø), Iceland (Leirvogur), Sweden (Kiruna) and Finland (Kevon, Kilpisjärven, Muonion, Ranuan) and depending on your active location, we will use one of this station to give you the real-time data of aurora.
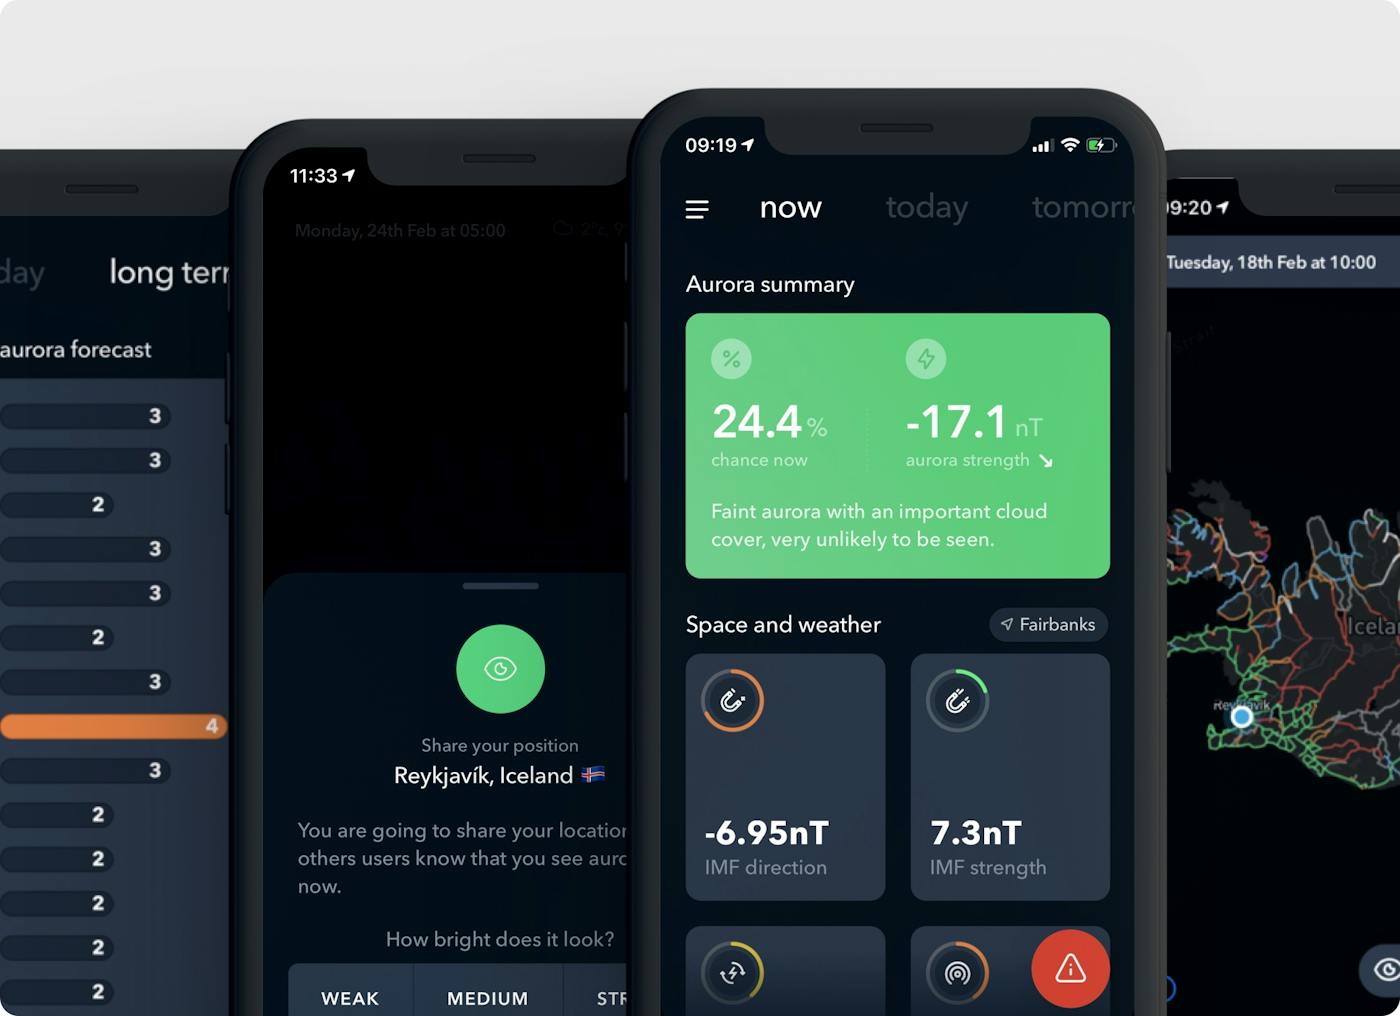
In the application, you will now find this information on the main block on the "now" tab, it's called "aurora strength". We also re-design this block to be easier to understand and more meaningful depending on the data.
