Why real-time data matters for aurora viewing
Most other aurora apps rely on the Kp index an average 3 hours based value taken from multiple location around the globe, even in some non-aurora places which is not real-time and accurate for Northern Lights hunting. The Kp index provides average regional predictions rather than real-time conditions, and aurora activity changes rapidly throughout the night. Strong, spectacular aurora displays can occur even when the Kp index shows low activity levels, meaning users relying on this metrics often miss incredible viewing opportunities.
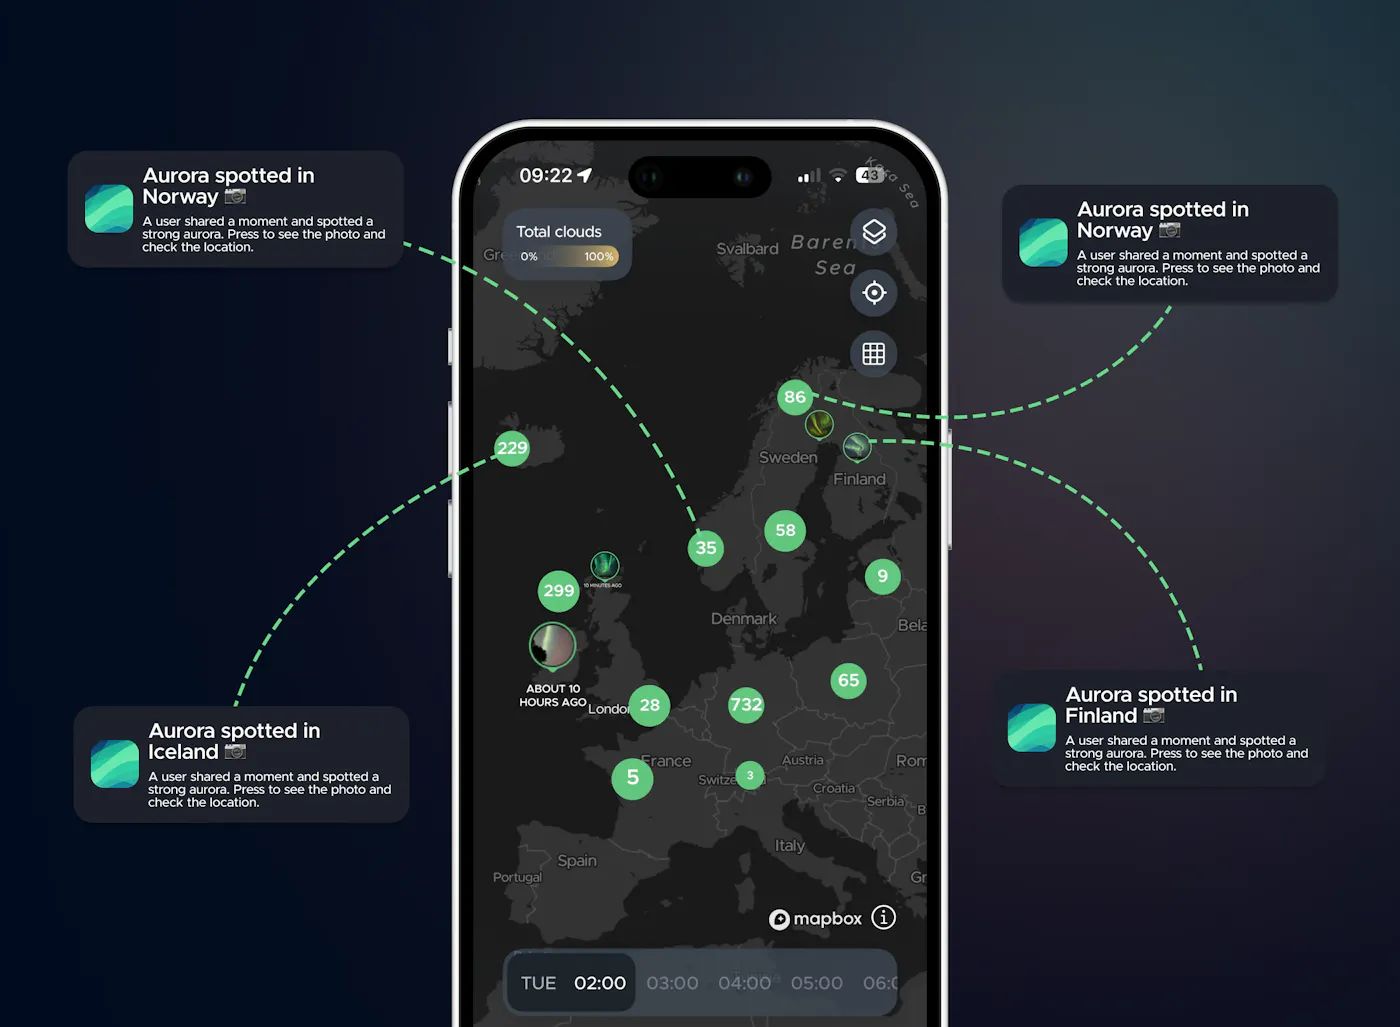
Use Real-time data instead of KP index
Real-time forecast updates every few minutes so you can get the latest aurora activity as it happens, not hours-old predictions
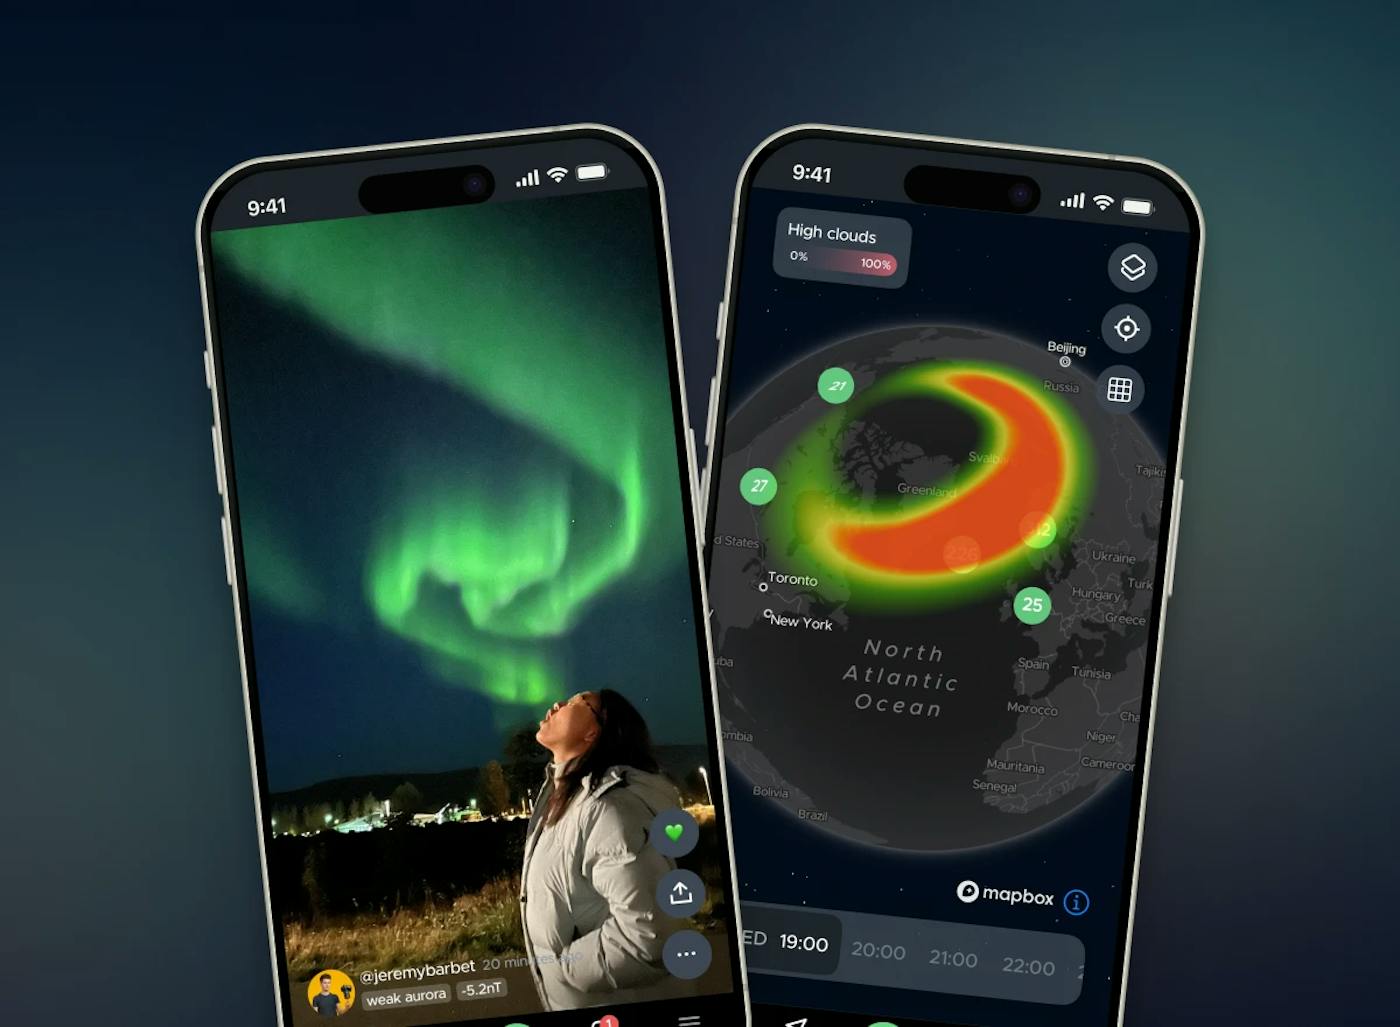
Real-time aurora forecast
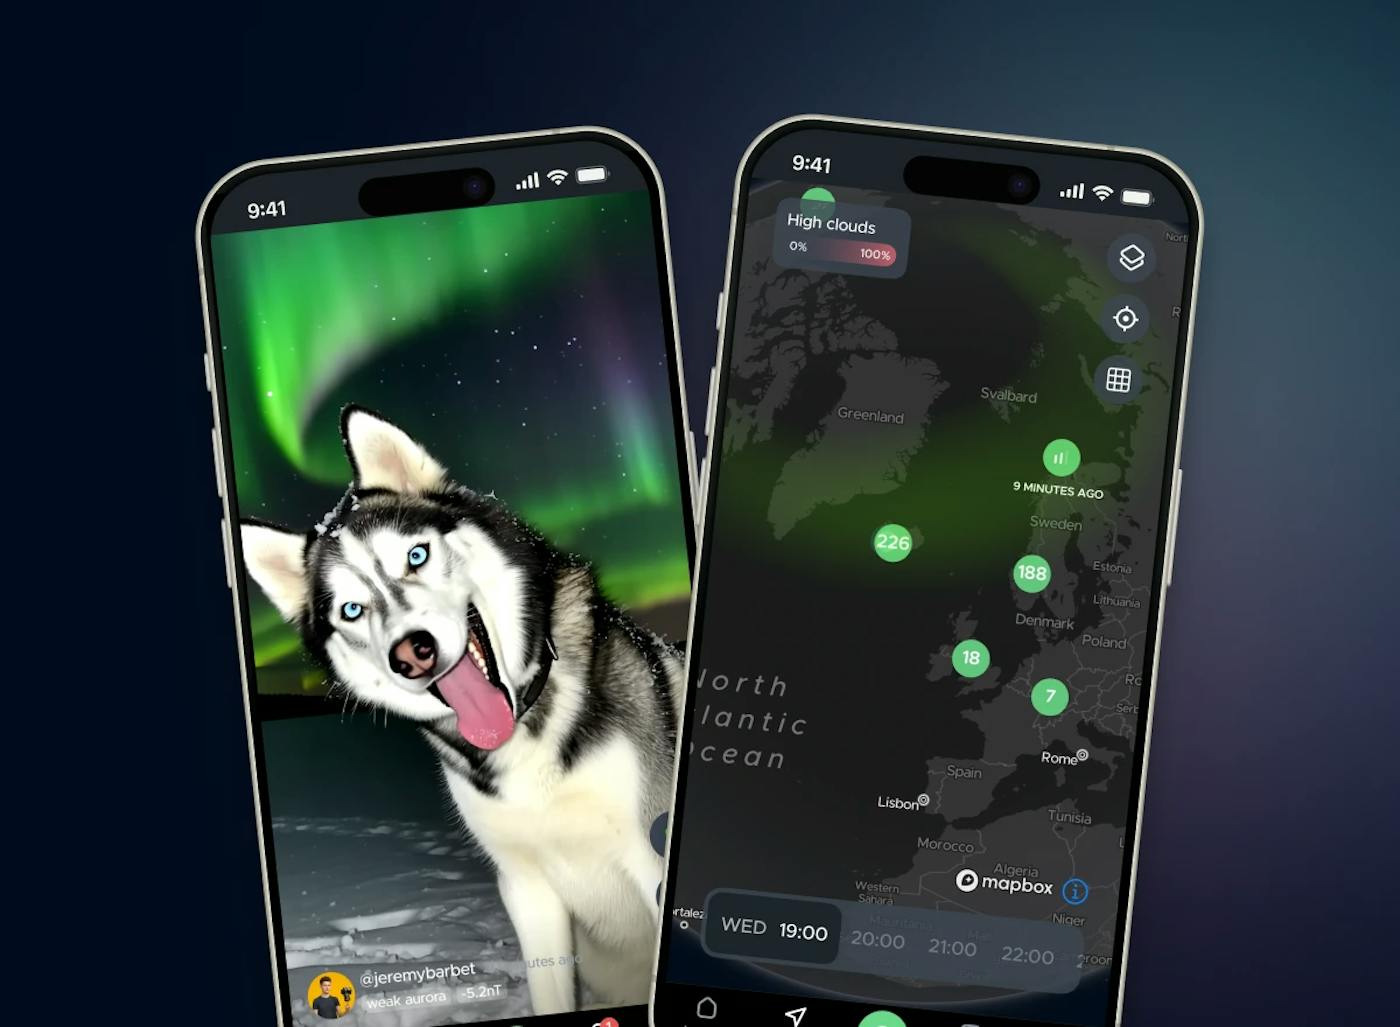
Hello Aurora helps users see the Northern Lights by using real-time data from scientific magnetometer stations across the Arctic. Since 2020, we have used data from multiple space agencies. The app automatically selects the magnetometer station closest to your location for aurora predictions.
This real-time forecast updates every few minutes, giving you the most current and accurate information available.
Why real-time data matters for aurora viewing
Most other aurora apps rely on the Kp index, a 3-hour average taken from multiple locations around the globe, including non-aurora places. This makes it slow and too general for serious Northern Lights hunting. Strong, spectacular aurora displays can happen even when the Kp index shows low activity. Hunters who rely on Kp index alone often miss these moments.
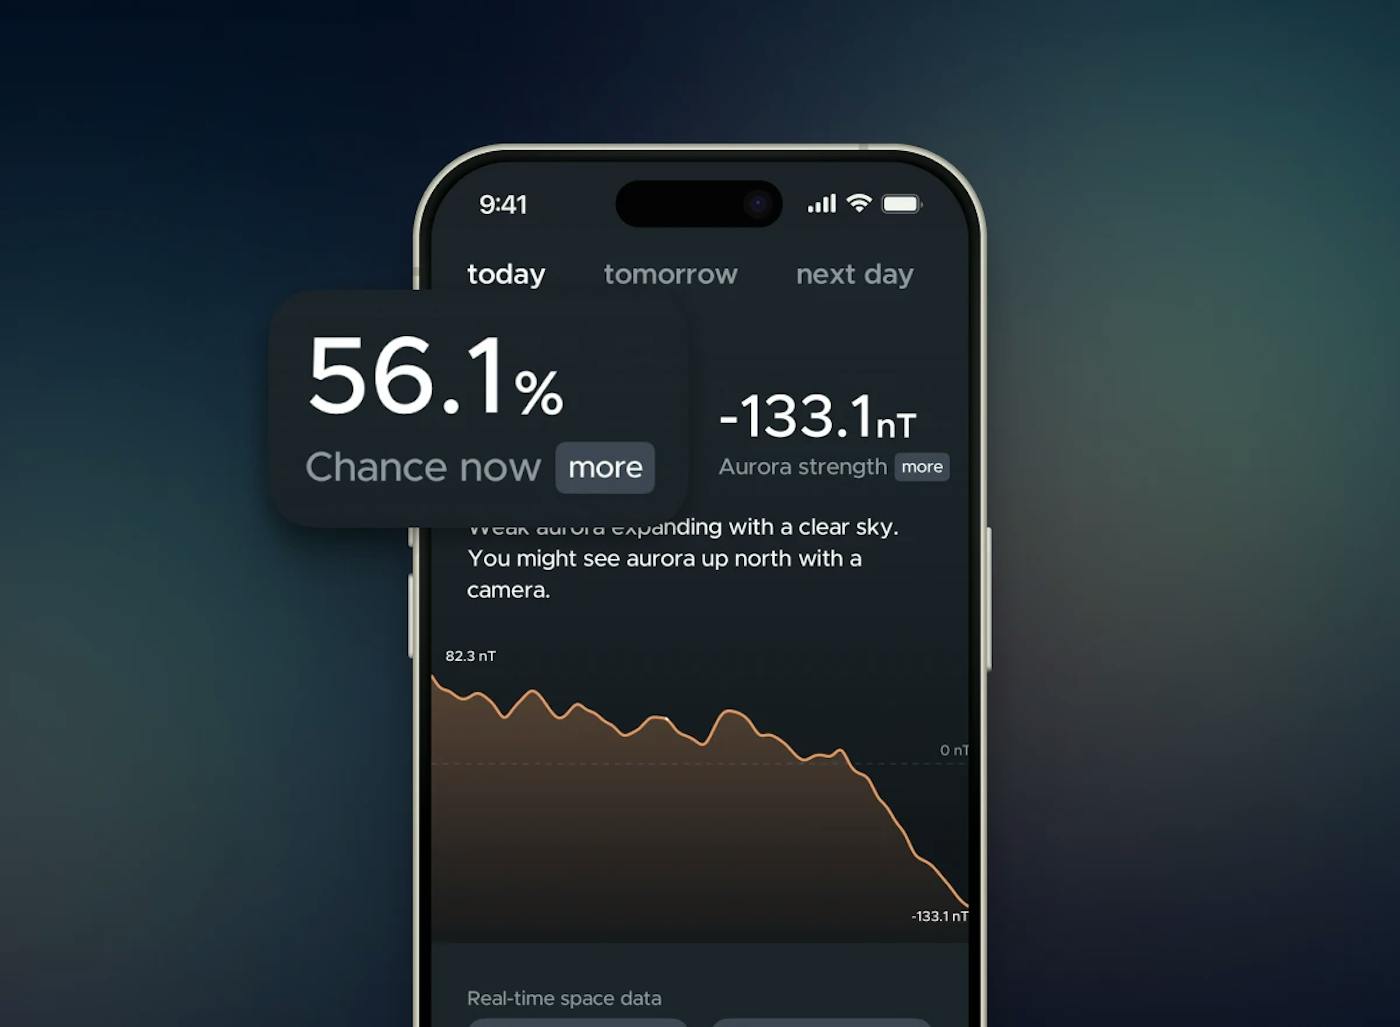
Aurora strength, explained simply
On Hello Aurora, the main number you'll see is aurora strength. Think of it as your go or no-go signal. No raw satellite charts, no guesswork, just one number that tells you how likely the Northern Lights are to be visible right now, updated every few minutes.
The Northern Lights happen when charged particles from the sun hit Earth's magnetic field. This makes the field vibrate, bend and fluctuate. Magnetometers near you pick up these fluctuations and record them in a unit called nanoteslas (nT). The bigger the fluctuation, the more intense the display.
- Drops sharply, around -150 nT: a substorm is happening. The lights are likely dancing right now. The lower it goes, the wilder and brighter the show.
- Spikes up, around +150 nT: the aurora is charging up. Get your camera ready, a display is often just minutes away.
- Hovers near zero, around 5 nT: the skies are quiet for now. Time to grab a warm drink and wait.
Solar wind data: Bz and Bt explained
According to the NOAA Space Weather Prediction Center, solar wind magnetic field data is tracked using Bt, the total field strength, and Bz, its north-south direction. When Bz points south (a negative value), solar wind connects more easily with Earth's magnetic field. This raises the chance of visible aurora.